American FactFinder
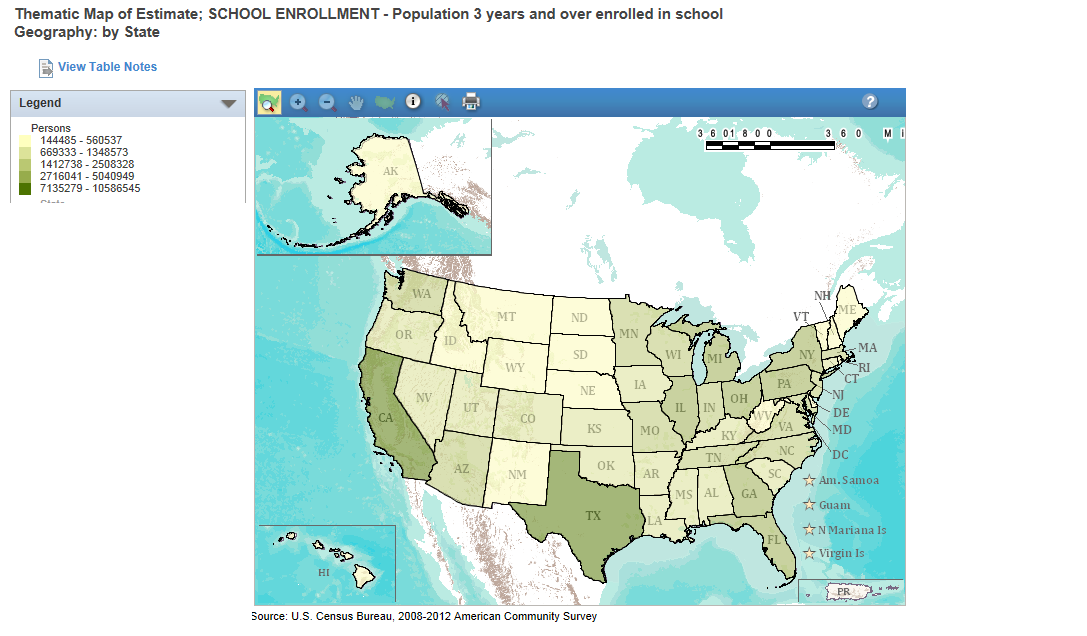
1.My hypothesis was that the number of children who are enrolled in schools under the age of three is higher in the more dense and urbanized states like the north eastern United States and California. I thought of this because the people who enroll their children in school at such an early age are doing it because they work and the highest number of workers are found in states that are densely populated and contain many major urban cities. To create this map, first you must go to American FactFinder website and then click on Guided Search. Then for step 1, you must select what general category you want your data to revolve around (people, housing, industry...etc). Chose people. In step 2, you select the topic of education and under that tab you select school enrolment. In step 3, you must select States as you geographic type and the consequently select all the states in the United States and Puerto Rico. Skip step 4 about Race and Ethnicity. In step 5, select the estimates for 5 years of selected social characteristics in the USA. When the table of data appears press on the button “Create a Map.” Then scroll down to the row that says “Population 3 years and over enrolled in school” and press on the first estimate for the first state and your chloropleth should appear.
2.The data partially supports my hypothesis because the map shows a darker color of green in the Northeastern United States and in California but in addition it also presents a dark green color in Texas. The darkest greens are in California and Texas so my hypothesis was partially correct.
3. Some concerns of chloropleth maps is that the same data can be represented in very distorted ways. The scale, the legend, the shape can all be distorted to present a selective truth. In my map, it leads to think that almost no one that lives in the central northern part of the United States sends their children to school before the age of three but what this map does not take into consideration is that those States are much less populated than other areas of the United States. In addition, the legend starts with the color dark yellow and ends with dark green, and while these are very contrasting colors, the middle three shades of green are quite similar. This color scale does not create a significant distinction between for example Arizona and Utah which at first glance even appear in the same category.
4.The map scale defines how much area is covered in the map. If we zoom into the state of Texas in my map and change the category of state to county then the amount of children under the age of three that attend school will not be as homogeneous as the previous map. In addition very rural or desert areas/counties will most likely have a much lower number of children under the age of three that are enrolled in school simply because less population lives in those areas. If we zoom out, to the point where state borders are not even visible anymore, then the map will appear as a homogeneous mild green with simply two darker spots (Texas and California) one to the south and one to the west. This will provide very vague information to the map reader and give them the information that the United States mostly as a whole has the same number of children under the age of three enrolled in school, other than those two spots.
5.American FactFinder could be an essential tool for finding the target audience for a service or product that is provided by public agencies or private corporations. These industries could use the compiled data in this website to decided where to market/advertise the product or service or even where to station themselves in a way to be surrounded by tons of potential customers.
